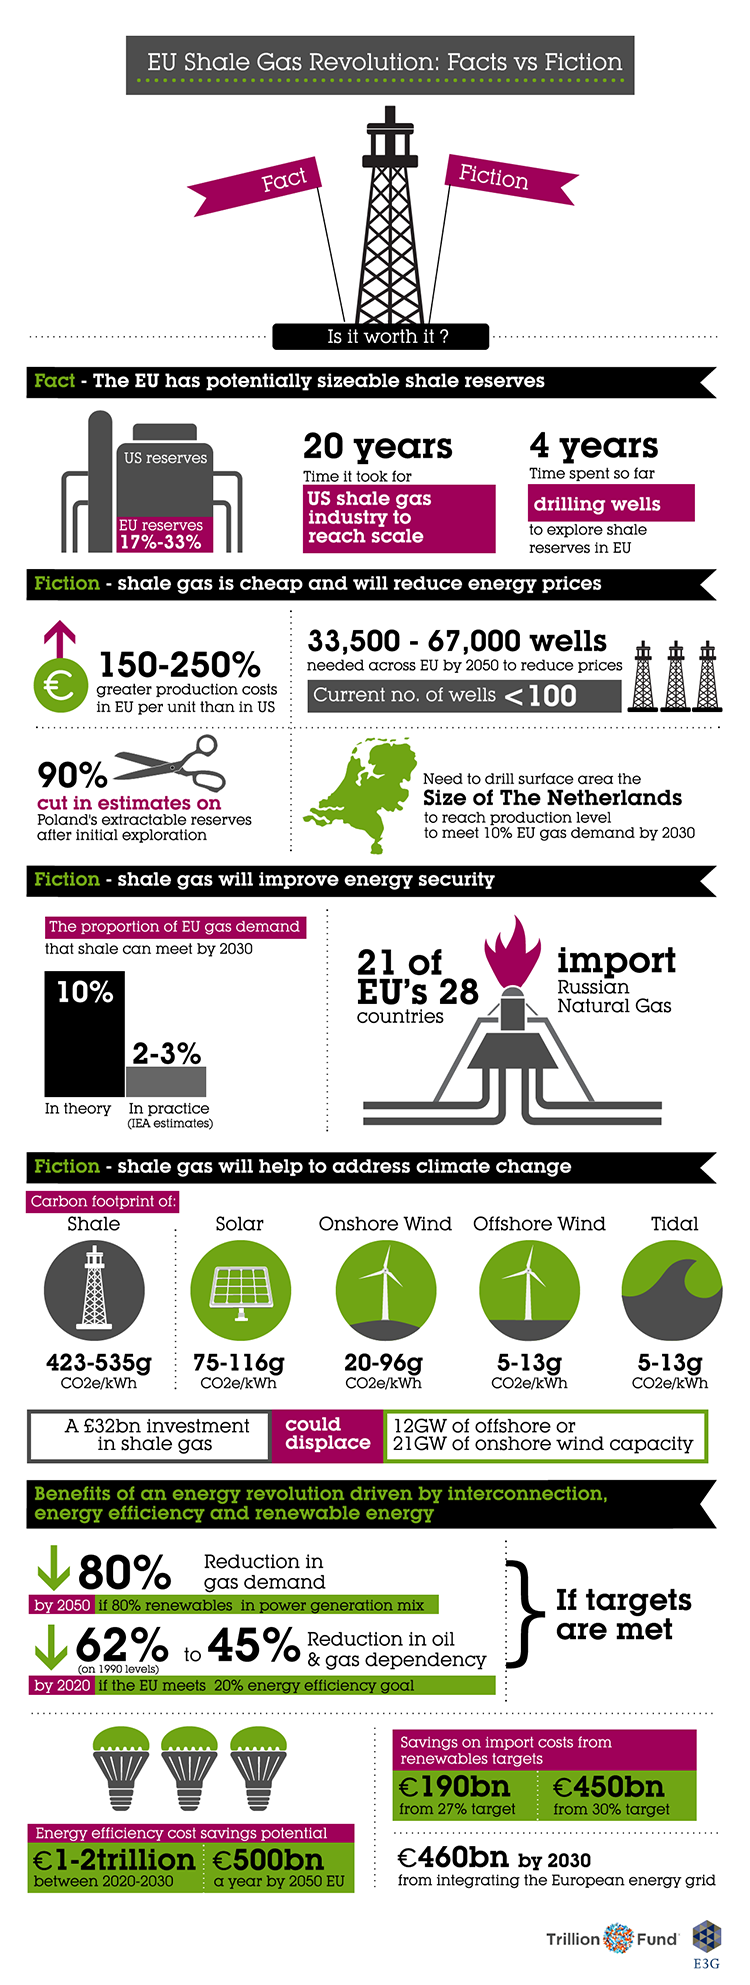
European Union (EU) dependence on energy imports is high and continuing to rise. In 2012, 55% of total EU energy supplies were imported at a cost of €400bn, equivalent to 3.1% of EU GDP [1]. European wholesale gas prices are currently 2-3 times as high as those in the United States (US) [2]. This is driving concern about the future competitiveness of European industry and is fuelling the debate over how the issue of rising energy prices can be effectively addressed in the context of the EU 2030 climate and energy package. In parallel, the crisis in the Ukraine has highlighted the risks of pinning the EU’s energy supply future on Russia, with 21 of the 28 EU Member States dependent on Russian gas imports[3].
Some argue that the solution to rising energy prices and energy security concerns lies not in cutting demand for energy imports by improving energy efficiency whilst expanding Europe’s renewable energy capacity, but in exploiting the substantial European shale gas reserves. They point to the example of the US as showing the way forward. In the US the shale gas boom has seen liquid natural gas imports reduced by 77% from their 2007 peak by 2012 [4] and US gas spot prices reduce from a 2008 average of $8.86 to $3.73 in 2013[5]. The US is expected to start exporting shale gas from 2015. Building on the US example, it is frequently argued that European shale gas represents a plentiful and cheap source of energy that will not just cut European energy prices but also improve energy security and help address climate change.
This briefing (attached) looks at whether the fundamentals underpinning the proposed EU shale gas revolution support these claims.
The german version of this article is available here.
Infographic produced with the Trillion Fund.
References
[1] IEA World Energy Outlook 2013 and The European Commission ‘ A Policy Framework for Climate and Energy 2020-2030’ January 2014.
[2]https://ec.europa.eu/energy/observatory/gas/doc/20130814_q2_quarterly_report_on_european_gas_markets.pdf and
[3] Gas data from Euroga, BP Statistical Review of World Energy 2013 and https://ec.europa.eu/energy/publications/doc/2013_pocketbook.pdf
[4] https://www.ferc.gov/market-oversight/reports-analyses/st-mkt-ovr/2012-som-final.pdf
[5] https://www.eia.gov/naturalgas/monthly/pdf/table_03.pdf
Great infographic on #ShaleGas facts & fiction https://t.co/LoEjaQp2yG via @EthreeG & @TrillionFund
— Pale Blue Dot Energy (@PBDEnergy) April 25, 2014