Shadow carbon pricing is a widely-used instrument encouraging low-carbon investment. Shadow carbon pricing differs from other carbon pricing policies like carbon taxes which incur actual costs, because it is used internally within financial appraisals to de-prioritise high-emission projects. If employed at the right level, theoretically, only projects compatible with a low-carbon transition would get the green light.
On its own, shadow carbon pricing, will not catalyse a transformation, as a wider range of initiatives are needed. Used correctly however, it can be an effective tool for encouraging low-carbon activities and preventing high-carbon ones.
The High-Level Commission on Carbon Prices (HLCCP), co-chaired by Nobel Laureate Joseph Stiglitz and Lord Stern, recommended carbon prices of $40-$80 per tonne of CO2 by 2020 and $50-100 per tonne by 2030 to keep global warming below 2°C.
Multilateral Development Banks (MDB’s) will be key in mobilising sustainable finance to avoid climate impacts – and a strong carbon price can support this.
In 2014, six development banks agreed to use a ‘shadow carbon price in appropriate cases’. The Inter-American Development Bank (IADB) and African Development Bank (AFDB) still do not currently use an internal carbon price.
At the recent One Planet Summit in December 2017, the World Bank Group committed to applying a shadow carbon price for all projects in key high-emitting sectors. Setting the correct price in these cases is important. The following assesses how these banks are performing against the High-Level Commission’s recommendations.
How are development banks performing?
Figure 1 below shows the range of carbon prices currently used by MDBs. The World Bank and European Investment Bank (EIB) both use a choice of three prices – a high, central and low price. The Asian Development Bank (AsDB) and European Bank for Reconstruction Development (EBRD) only use a ‘central’ price. The shaded ranges (below) show the difference between the ‘high’ and ‘low’ carbon prices the World Bank and EIB use in project assessments.
Figure 1 shows none of the central prices are within the top half of the range recommended by the HLCCP. Between 2020-2029, the World Bank’s central carbon price falls below the minimum. However, the One Planet Summit announcement will see the World Bank prices align with the HLCCP. By 2030, AsDB has the lowest carbon price. The ‘low’ prices from EIB and the World Bank fall below the HLCCP recommendations, whilst the ‘high’ prices perform well.
EIB has the highest initial central price and uses a ratchetting mechanism so it maintains the highest price to 2050. AsDB and EBRD both use a 2% annual increase, a slower increase than the World Bank, this suggests they should increase their rate of increase to match other banks.
Figure 1: Comparison of development bank shadow carbon prices
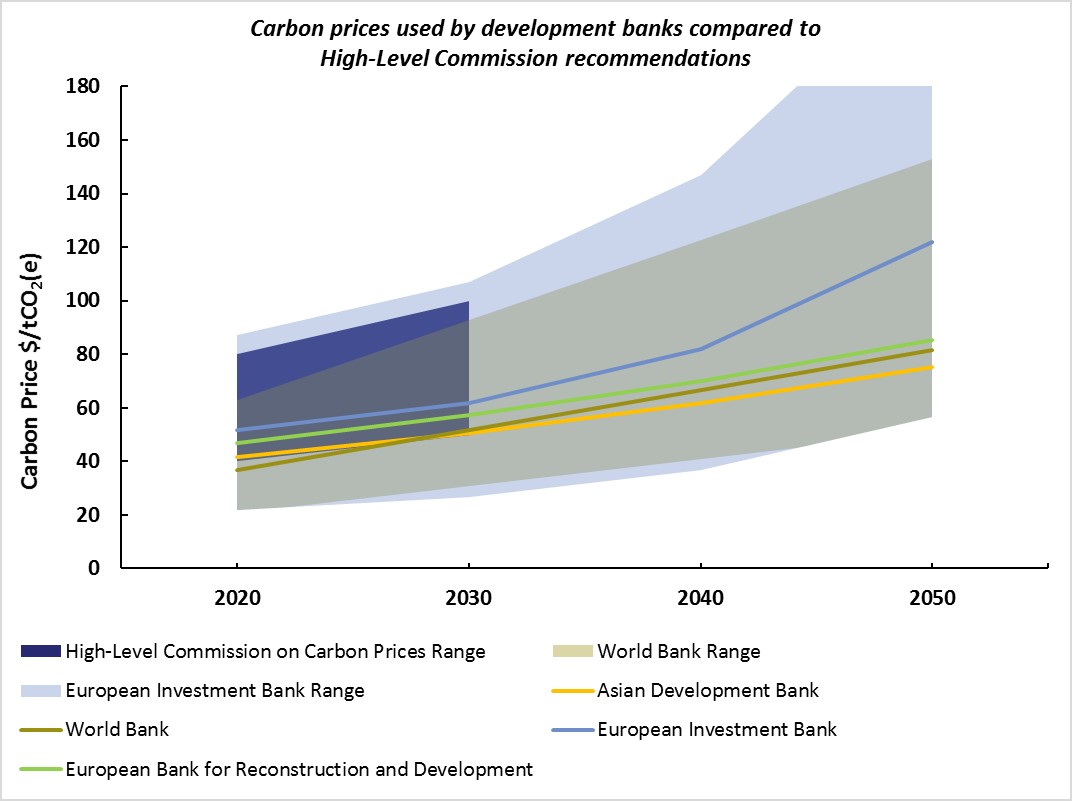
Sources: EBRD (2014), World Bank (2015), HLCCP (2017), EIB (2015; ASDB (2017), All in 2016 prices, adjusted for inflation and EBRD and EIB prices have been converted from EUR to USD using OECD conversion rates. Also, the EIB and EBRD use ‘tonnes of carbon equivalent’, while the others refer to ‘tonne of carbon’; it is not clear whether ‘carbon’ is being used as a shorthand in these documents.
How are these prices used?
The table below in figure 2 summarises how MDBs use carbon pricing.
Figure 2: Summary of Development Bank Carbon price usage
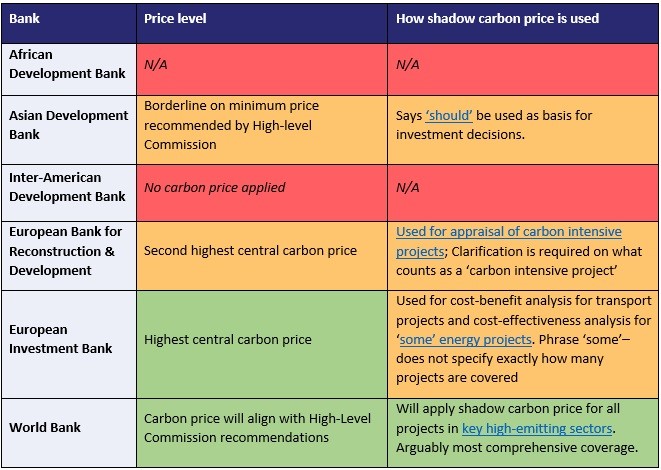
Sources: ADB (2017), EBRD (2013), EIB (2016), World Bank (2017).
Prices require updating to account for changing science in understanding climate risks. EIB’s prices will be ‘periodically reviewed in light of the growing evidence from the climate modelling literature’. More detail on price reviews are required from other banks.
Problems and drawbacks
Shadow carbon pricing it is not a ‘silver bullet’. The price has to be set at the right level to have an impact. Climate models are used in estimating price levels, but these models have limitations. Climate impacts such as loss of biodiversity are difficult to translate to dollar costs, so are not factored in.
Tipping points may also occur in the climate system. Thus, costs may be underestimated. One study estimated that if a rapid, high-impact tipping event was taken into account, today’s optimal carbon tax is increased by >200%.
Moreover, carbon pricing is not sufficient to incentivise green investment in all sectors, e.g. buildings and transport. There’s already an economic case for zero-carbon buildings, but incentives are not aligned, as developers do not benefit from resulting energy savings. In transport, the World Bank found high carbon prices were not sufficient to favour low-carbon transport. Where there are no alternatives (such as seaports), a carbon price is also of limited value.
Finally, fossil fuel subsidies can act as ‘negative’ carbon prices in the opposite direction. Many such subsidies still exist. It’s clear carbon pricing needs to be accompanied with other tools to incentivise green investment.
The World Bank’s recent announcement sees it leading on carbon pricing, with EIB and EBRD following behind. AsDB and EBRD must increase their shadow carbon price and rate of increase to match other MDBs. IADB and AFDB are lagging, with little public information on whether, if any, shadow carbon pricing is used.
Adopting an ambitious shadow carbon price in line with the HLCCP’s recommendation will signal that MDBs are serious about shifting finance towards low carbon projects. As banks continue to develop energy policies and climate action plans, this provides an opportunity to update their carbon prices. This must be done alongside other mechanisms to transition finance towards a low-carbon pathway.
Note: This article was first published on 24th January 2018. Since this article was published, new information from the EIB and AsDB has clarified that both banks use carbon pricing as the basis for investment decisions, and that for EIB this is applied in cost-benefit analysis in all sectors where cost-benefit is done.