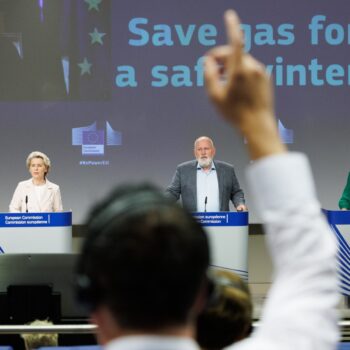
European Commission’s “Save gas for a safe Winter” plan in preparation for a potential sudden interruption of gas flows from Russia will be submitted to the Energy Council for approval on 26 July. The plan aims at a binding 15% reduction of gas consumption in Europe between 1 August 2022 and 31 March 2023. This is expected to be hotly contested among EU Member States.
Data: 2019 gas consumption per sector in the EU
E3G has prepared data to support decision-making on the EU gas sector debate. All data is from Eurostat, extracted in July 2022.

Headline messages:
EU Member States and citizens have the capacity to act to jointly reduce gas use. They have the power to respond to the challenging circumstances if they work together. The EU Member States have recently demonstrated the capacity to work with partners and help deliver massive, coordinated programmes at scale – e.g. COVID-19 response. They can do it again to lower gas demand via open dialogue, and cooperation with business and social partners.
The variety of Member State economies becomes a strength in this context. Gas consumption of EU Member States varies massively. Therefore, there is opportunity for tailored activity and support to reduce gas demand in all countries:
- In IE, EL, ES, FI, LV, IT, and PT, consumption is extremely concentrated in the power sector (>40% share of gas use). Many no-regret solutions are available to reduce gas consumption in the power sector: efficient appliances, renewable energy, and demand side flexibility. Any measures that support the reduction of electricity consumption can help (for example, building renovation measures to limit electrical cooling and heating demand; incentivising the use of efficient electrical appliances; energy auditing for businesses)
- In DE, FR, HU, RO, and SK households are among the biggest users. Priorities to ensure resilience for this and subsequent years are: short-term information campaigns targeted at higher earning users, financial support for those in energy poverty, and a push on renovation and electrification. These can be rolled out nationally with the right combination of information campaigns, scale-up of independent and impartial citizen advisory services, and targeted financial support, especially for the vulnerable. There are additional simple and cost-effective measures that can be rolled out alongside (such as thermostats, boiler optimisation, simple insulation measures).
- In BG, CZ, LU, AT, PL, SI, and SE countries, the largest driver of gas use is industry. The potential for energy efficiency and electrification is deemed to be high across industrial end use but have been understudied. National resilience and recovery plans already include programmes for modernisation of industrial activities in some of those countries which can help if optimised and implemented at speed. To be able to leverage this at scale, and turn action in this crisis into investments into long-term economic competitiveness, data on gas use in industry needs to be collected at speed. It must also have sufficient granularity (in particular identifying low-temperature heating processes that can be replaced with more modern solutions). In some countries, certain sub-sectors in industry drive gas consumption – for example, in DE, (petro) chemicals represent 7% of the country’s gas consumption alone (non-feedstock use only).
These variations indicate where to target quick action. Yet, most countries use gas in most sectors. There are opportunities to exchange best practices and to tailor responses based on countries’ specific delivery capacity and existing networks to work at speed.
- With the exception of CY (no gas) and MT (gas only in power), all countries use gas across the board in different sectors.
- Use of gas for the energy sector’s own use (not heat/electricity generation) can be a prime candidate for delivering efficiency in a few countries. In DE, ES, HR, PL, energy gas use covers 8-18% of total consumption, compared to the EU average of 4%.
Large gas consumers need to take responsibility, but opportunity to increase efficiency exists for all. Gas demand reduction is an opportunity to limit the impact of inflation and improve competitiveness.
- 50% of overall gas consumption takes place in three countries: DE, IT, FR.
- 50% of gas consumption in electricity generation takes place in three countries: ES, DE, and IT (closely followed by NL).
- 60% of gas consumption in households in three countries: DE, FR, and IT.
- 50% of gas consumption in industry takes place in three countries: DE, IT and FR, closely followed by Spain.
- The gas to GDP ratio (2021) is above average in some European countries (BE, BG, CZ, EL, HR, IT, LV, LT, HU, NL, PL, RO, SK), pointing to potential scope for efficiencies in terms of turning gas into value for the economy.
- The gas per capita ratio in BE, DE, IE, IT, LU, NL, HU, and AT is above the European average.
Download E3G briefing with EU gas sector data for decision makers here.